VPS usage statistics can help users monitor their server performance and resource consumption. Some of the common metrics that Hivelocity VPS users can track are CPU utilization, memory utilization, disk utilization, and CPU load values.
These statistics can help users optimize their server configuration, troubleshoot issues, and plan for future growth. To view the usage statistics of your Hivelocity VPS, proceed with the steps below.
Viewing the VPS Usage Statistics
To view your VPS usage statistics, proceed with the following steps.
- Head over to Hivelocity.net and login to the customer portal.
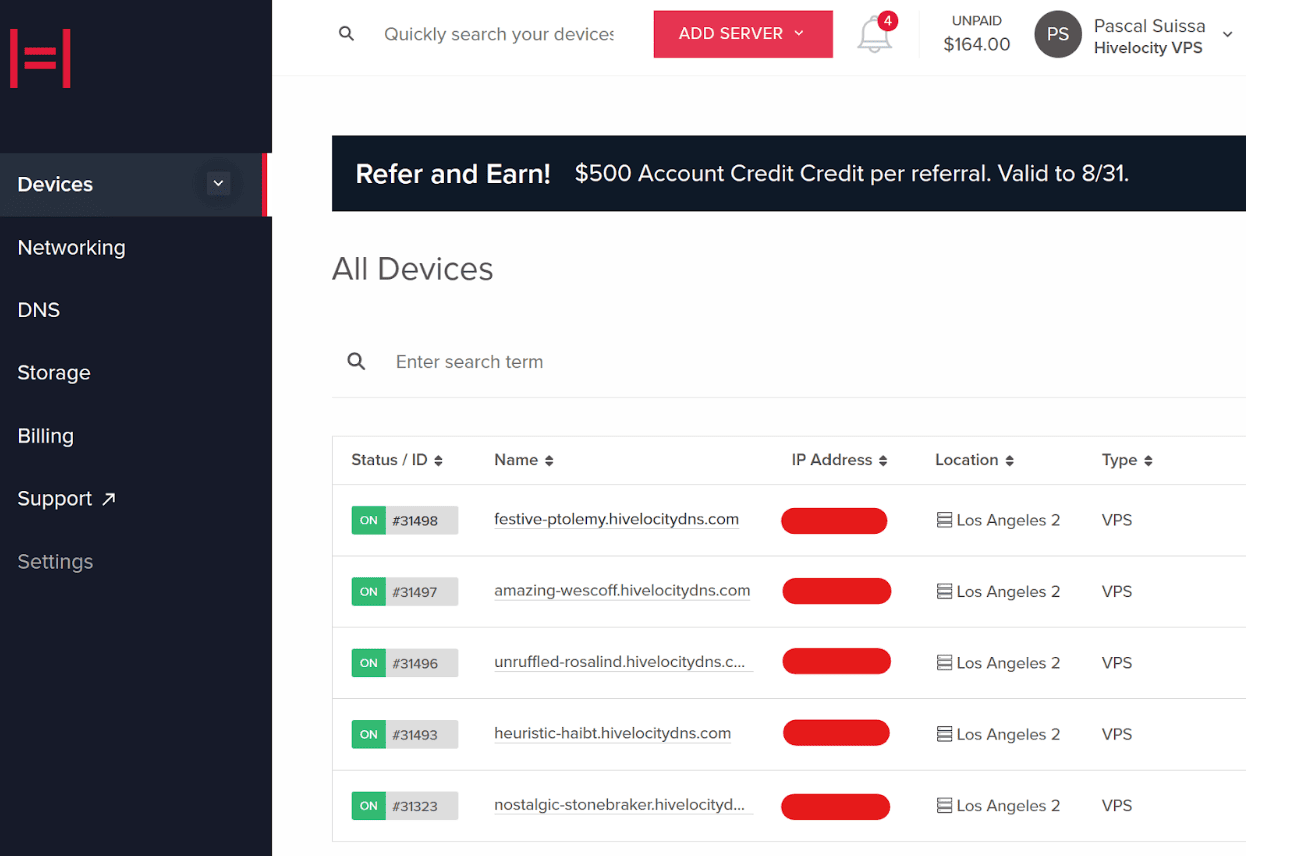
- Once you’ve gone through the login process. The screen below will appear, listing all of your current devices.
- You can note which device is VPS and which is a dedicated server by looking at the “Type” column as needed.
- You can note which device is VPS and which is a dedicated server by looking at the “Type” column as needed.
- Press on the device ID you wish to view the usage statistics with, for this example, we will select device 31498 from the list above.
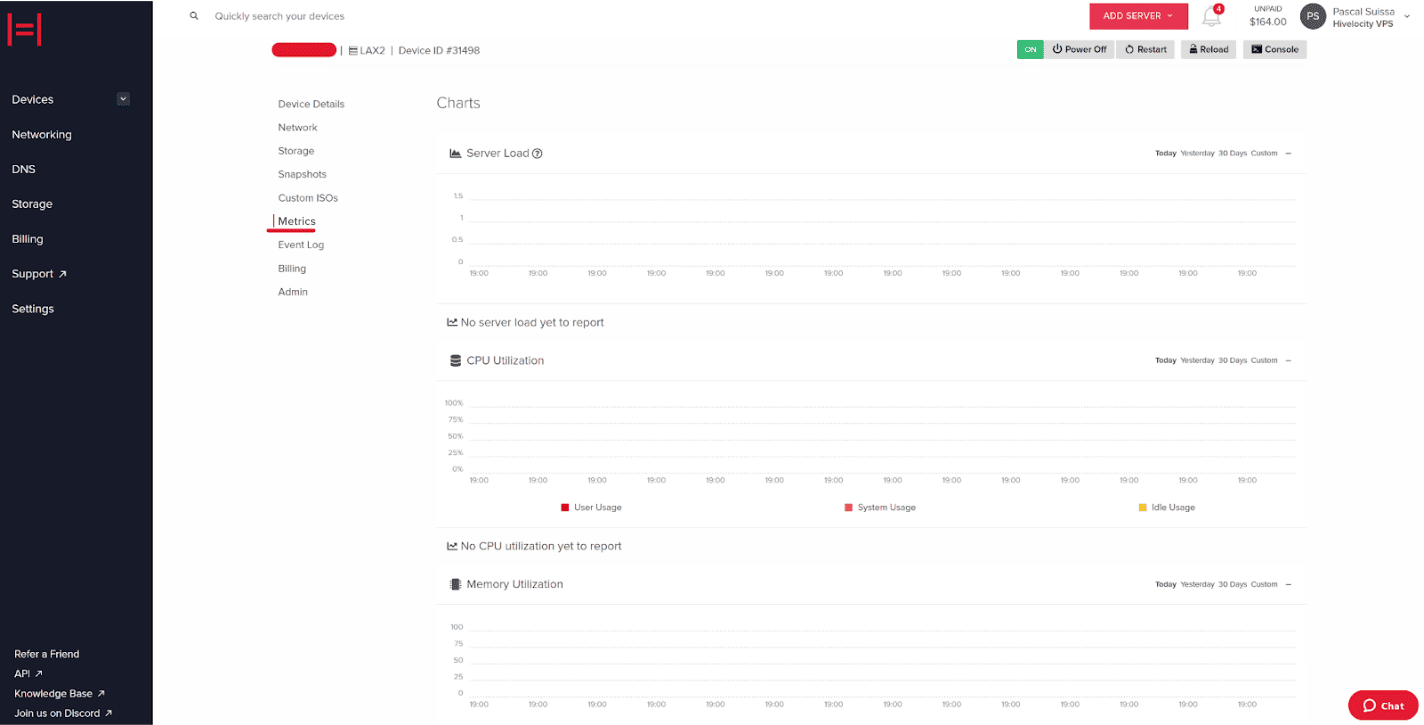
- In the next screen, you can view further information regarding your VPS along with the option to press the “Metrics” link.
- Once you’ve pressed the “Metrics” link, you will be directed to the page below which will display usage statistics involving your VPS.
- Note that there is another section on the page involving disk utilization.
- Note that there is another section on the page involving disk utilization.
-
The usage statistics can be filtered to display value from Today, Yesterday, 30 Days, and a custom range.
-
The following four sections are available to view usage statistics.
-
Server Load – Will display a measure of how much work a server is performing at that given time. A high server load can result in poor performance and slow response time.
-
More information about server load can be found in the following article – https://www.hivelocity.net/kb/understanding-the-server-load-metric/.
-
-
CPU Utilization – Will display the percentage of the server’s processing power used by applications and processes running on it
-
Memory Utilization – Will display the usage value of the available memory resources in the system.
-
Disk Utilization – Will display the disk usage values as the drive is used by the system.
-
It is important to note that some or all data may fail to report, particularly after a new provision or reinstall. For information involving current usage values, please reach out to the Hivelocity’s Support team to retrieve the information as needed.
– by Pascal Suissa
