Monitoring server load is an important task when managing a server. Making sure the load isn’t too high will keep the hardware safer and prevent outages and downtime. This article explains the finer points of how to find your server load, understanding it, and offers solutions for managing it.
The top command in Linux is a system monitoring tool that provides a dynamic, real-time view of the processes running on a system along with details about resource usage such as CPU, memory, and swap usage. The command also displays system load averages, which indicate how busy the system is. The command can be customized to show only the information that is relevant to the user, such as sorting by a specific field, changing the units of memory, or highlighting the processes that consume the most resources. Overall, the package is useful for identifying and managing the processes that affect the system performance and stability to allow you to better manage your server.
Using and Understanding top
Once you’ve just gotten access to your new server, you can check the server load by running top. Running the top command will give you a screen similar to the one below.
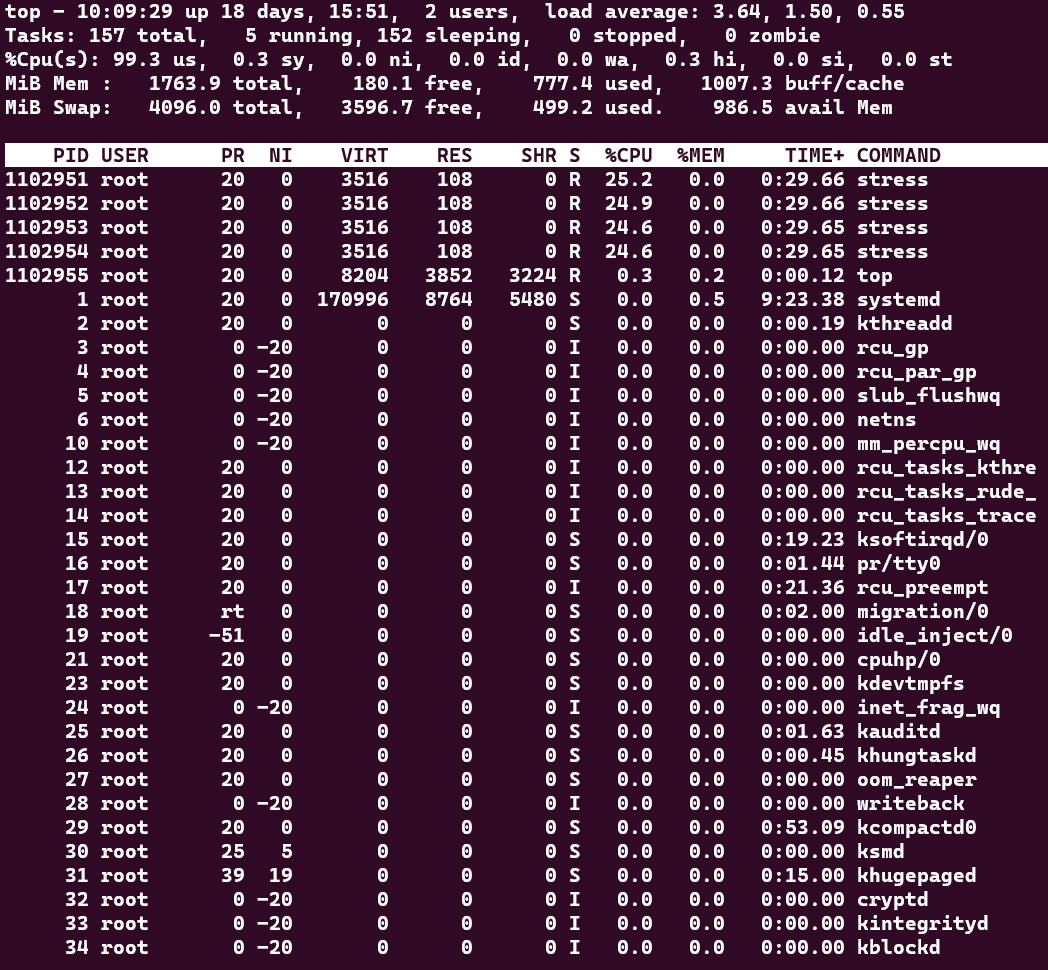
Key information pieces that can be retrieved from top are listed below.
- The current time, system uptime, number of users, and load averages.
- The total number of processes, running processes, sleeping processes, stopped processes, and zombie processes.
- The percentage of CPU usage by user processes, system processes, idle processes, and waiting processes.
- The amount of physical memory and swap memory used and free.
- The list of processes sorted by a field (default is CPU usage), showing the process ID, user name, priority, nice value, virtual memory size, resident memory size, share memory size, state, percentage of CPU usage, percentage of memory usage, and command name or line.
Top’s Upper Section Description
Looking at the top section of the top output, as shown below, can reveal key information.
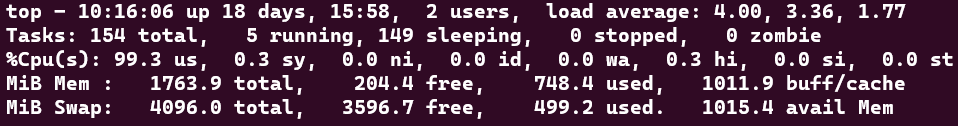
The explanation will be done left to right, line by line.
-
- System uptime and current logged user count is displayed as the first piece of information within the block and is shown in hours and days along with the current time along with the number of logged users
top - 10:16:06 up 18 days, 15:58 - Load averages are presented in 1, 5. and 15 minute intervals.
load average: 4.00, 3.36, 1.77 - Total tasks and their status are presented as running, sleeping, stopped, and zombie.
Tasks: 154 total, 5 running, 149 sleeping, 0 stopped, 0 zombie- The running state means that the process is either executing on the CPU or waiting for the CPU.
- The sleeping state means that the process is waiting for some event to occur, such as user input or disk I/O.
- The stopped state means that the process has been suspended by a signal, such as Ctrl+Z.
- The zombie state means that the process has terminated but its parent process has not yet read its exit status.
- CPUs status and activity listed as us, sy, ni, id, wa, hi, si, and st.
%Cpu(s): 99.3 us, 0.3 sy, 0.0 ni, 0.0 id, 0.0 wa, 0.3 hi, 0.0 si, 0.0 st- us: user CPU time, the time spent on user-level processes.
- sy: system CPU time, the time spent on kernel-level processes.
- ni: nice CPU time, the time spent on user-level processes with a positive nice value, which have lower priority than normal processes.
- id: idle CPU time, the time spent on idle tasks, such as waiting for I/O or other events.
- wa: I/O wait CPU time, the time spent on waiting for I/O operations to complete.
- hi: hardware interrupt CPU time, the time spent on handling hardware interrupts, such as keyboard or mouse input.
- si: software interrupt CPU time, the time spent on handling software interrupts, such as network packets or signals.
- st: steal CPU time, the time spent on involuntary wait by virtual CPUs while the hypervisor is servicing another virtual processor.
- Memory and Swap usage is displayed with total, free, used, and buff/cached and available memory values. The MiB Mem and MiB Swap sections in the top output show the physical and virtual memory utilization of the system respectively.
MiB Mem : 1763.9 total, 204.4 free, 748.4 used, 1011.9 buff/cache MiB Swap: 4096.0 total, 3596.7 free, 499.2 used, 1015.4 avail Mem- The MiB Mem section has four columns: total, free, used, and buff/cache.
- The total column shows the total amount of physical memory installed on the system.
- The free column shows the amount of memory that is not allocated to any process or buffer.
- The used column shows the amount of memory that is allocated to processes or buffers.
- The buff/cache column shows the amount of memory that is used for caching files or other data for faster access.
- The MiB Swap section has four columns: total, free, used, and avail Mem.
- The total column shows the total amount of swap space configured on the system.
- Swap space is a portion of the disk that is used as an extension of the physical memory when the system runs out of memory.
- The free column shows the amount of swap space that is not in use.
- The used column shows the amount of swap space that is in use.
- The avail Mem column shows the amount of memory available for starting new applications, without swapping.
- The MiB Mem section has four columns: total, free, used, and buff/cache.
- System uptime and current logged user count is displayed as the first piece of information within the block and is shown in hours and days along with the current time along with the number of logged users
Top’s Lower Section Description
Looking at the top section of the top output, as shown below, shows command and services currently running, by which user, and how much load are they adding to the system.
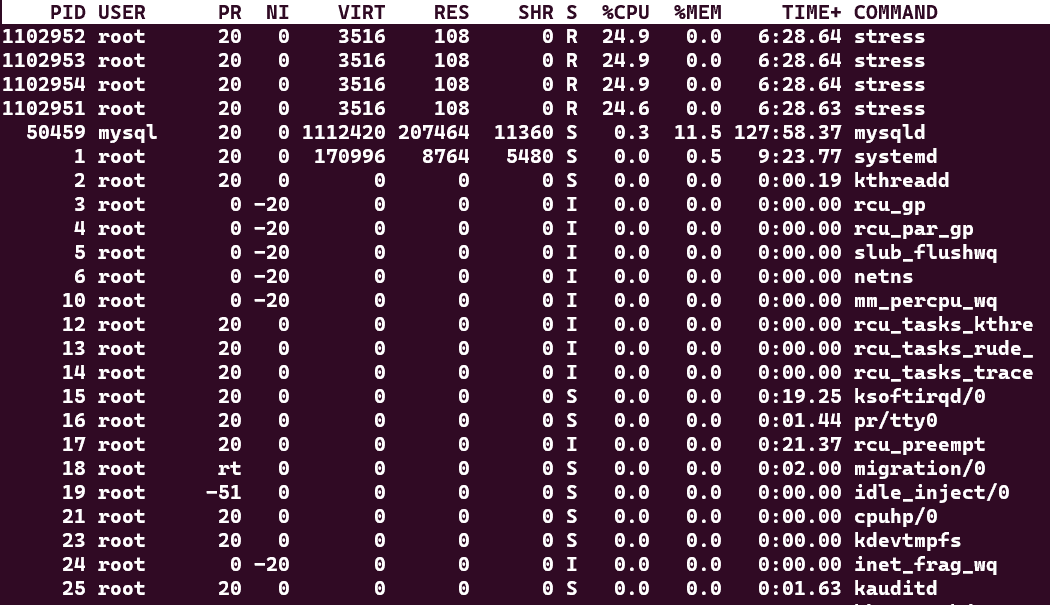
- PID: The process ID, a unique number that identifies each process.
- USER: The user name or ID that owns the process.
- PR: The priority of the process, which determines how much CPU time it gets.
- NI: The nice value of the process, which affects its priority. A lower nice value means a higher priority.
- VIRT: The virtual memory size of the process, which includes the code, data, and shared libraries.
- RES: The resident memory size of the process, which is the amount of physical memory it is using.
- SHR: The shared memory size of the process, which is the amount of memory it shares with other processes.
- S: The status of the process, which can be one of the following:
- R: Running or runnable, meaning it is either executing or waiting for CPU time.
- S: Sleeping or interruptible, meaning it is waiting for an event to complete.
- D: Uninterruptible sleep, meaning it is waiting for I/O to complete and cannot be interrupted by signals.
- T: Stopped or traced, meaning it is stopped by a signal or being debugged.
- Z: Zombie or defunct, meaning it has terminated but its parent process has not reaped it.
- CPU: The percentage of CPU time used by the process in the last sampling period.
- MEM: The percentage of physical memory used by the process.
- TIME: The total CPU time used by the process since it started.
- COMMAND: The name and arguments of the command that started the process.
Understanding Load Averages Values
CPUs come in many setups but what we need to know is that what we have can be a single core or a multi core CPU with the potential capability of hyperthreading.
A load of 1 in any of your averages means that there is enough load to fully use a single core of your available cores. A load of 4 would mean that there is enough load to occupy 4 of your system’s available cores.
With hyperthreading, if the CPU has 6 cores with hyperthreading, the count means that there are 12 cores in the system as work can be distributed better with hyprthreading and is calculated in that manner.
The number of cores in your system can be found using the nproc command as shown below.
psuissa@psuissa-WS-5524:~$ nproc
8
When you have more load than available cores is when the system gets overloaded and will display delays in response time and ability to serve web pages properly. You could view running processes as explained above to stop any that are causing high load but also allow you to investigate as to which and why it is happening.
How Can Hivelocity Help me?
We know that constantly checking these metrics can be a pain. At Hivelocity we offer a few Managed Services packages that will do all the work for you. We install tools that actively monitor this and many other metrics of your server and will alert us if there are any issues.
This will allow you the peace of mind of making sure your hardware is carefully watched, without having to constantly monitor it yourself. As a result, there is less risk of downtime and you save time and energy in the process.
To learn more about adding Managed Services to one of your servers, or purchasing a Managed Server from Hivelocity, open a chat session and our account managers will be happy to assist!
