Drive health in your Linux system can be evaluated and retrieved using various packages available within your operating system’s package manager. Drive health information is available primarily through a Self-Monitoring, Analysis and Reporting Technology [SMART] monitoring system, which is available in both hard-disk drives and solid-state drives. While the SMART data may not accurately predict a future drive failure, it can show abnormal error rates and provide important information that will assist you in making decisions that might save your data before suffering a drive failure.
Retrieving S.M.A.R.T Data
The commands listed in the sections below will provide you with information regarding the S.M.A.R.T data of your storage devices and their current health conditions. The following sections are divided by applicable device type.
Evaluating SATA Hard-Disk Drives and SATA SSDs
This section includes instructions for generating reports for SATA hard drives and is applicable to both spinning plate Hard-disks and Solid-state SSDs with no moving parts. The information for both types are gathered using the same smartmontools package.
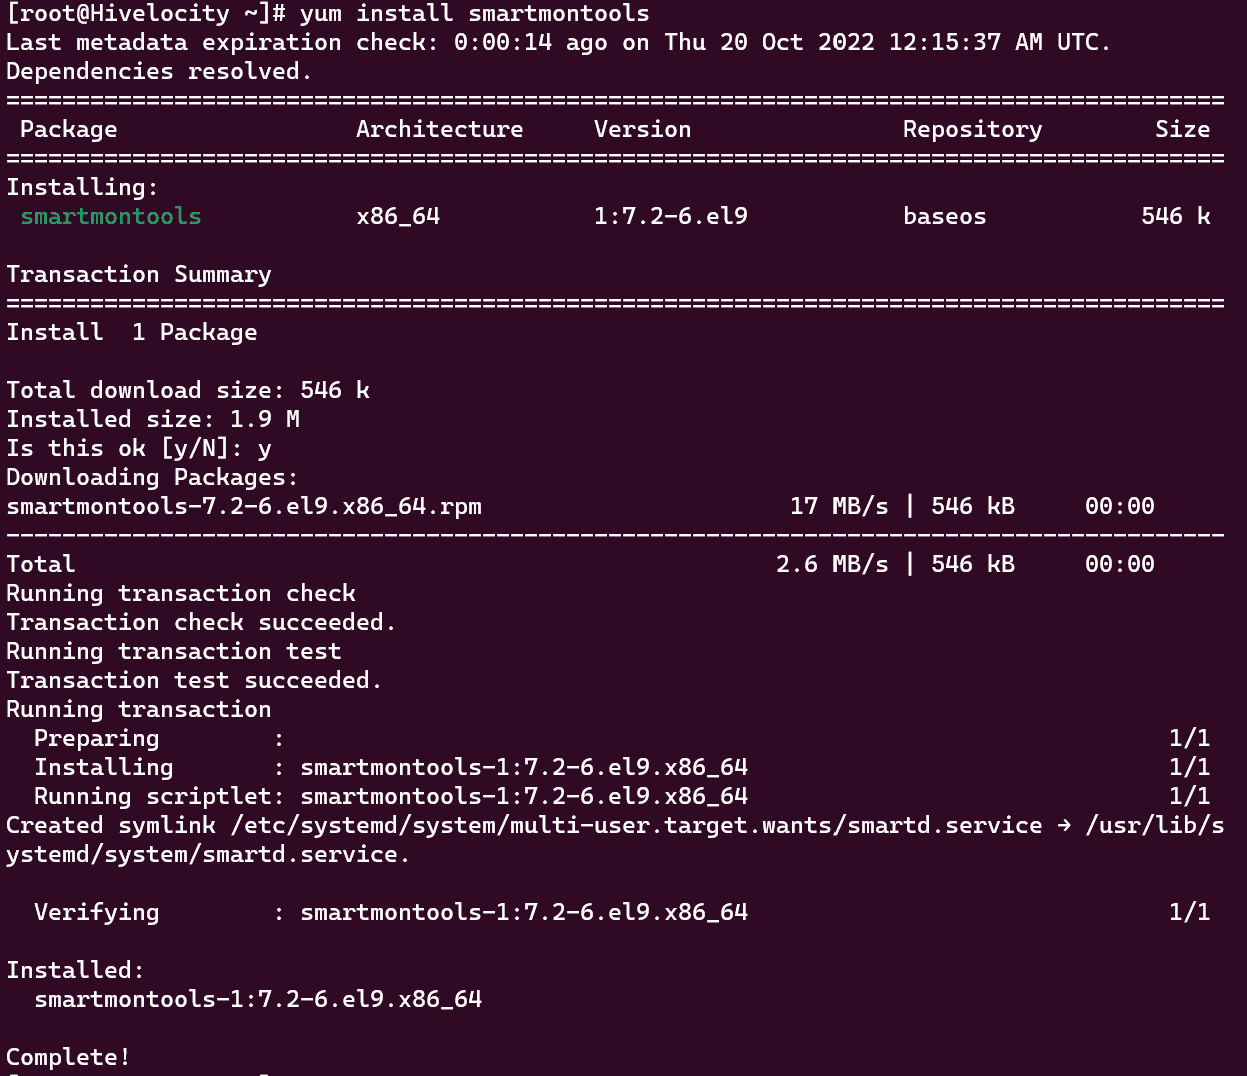
- First, if the package is not already available in your system, install smartmontools from your package manager using the following command:
yum install smartmontools
- Next, run the following command to list all the drives in the system that are available for evaluation:
lsblk

- Once you’ve found the drive you’d like to evaluate, grab the name of it and run the command listed below. The smartctl tool will then output the results of the S.M.A.R.T data along with further information such as how long the drive has been running, how many errors it has, and whether the S.M.A.R.T drive health test has passed or not. In this case, the example drive is /dev/sda. *Note: we are selecting drives here [sda, sdb, sdc], not partitions [sda1,sdb4, sdc7].
sudo smartctl -a /dev/sda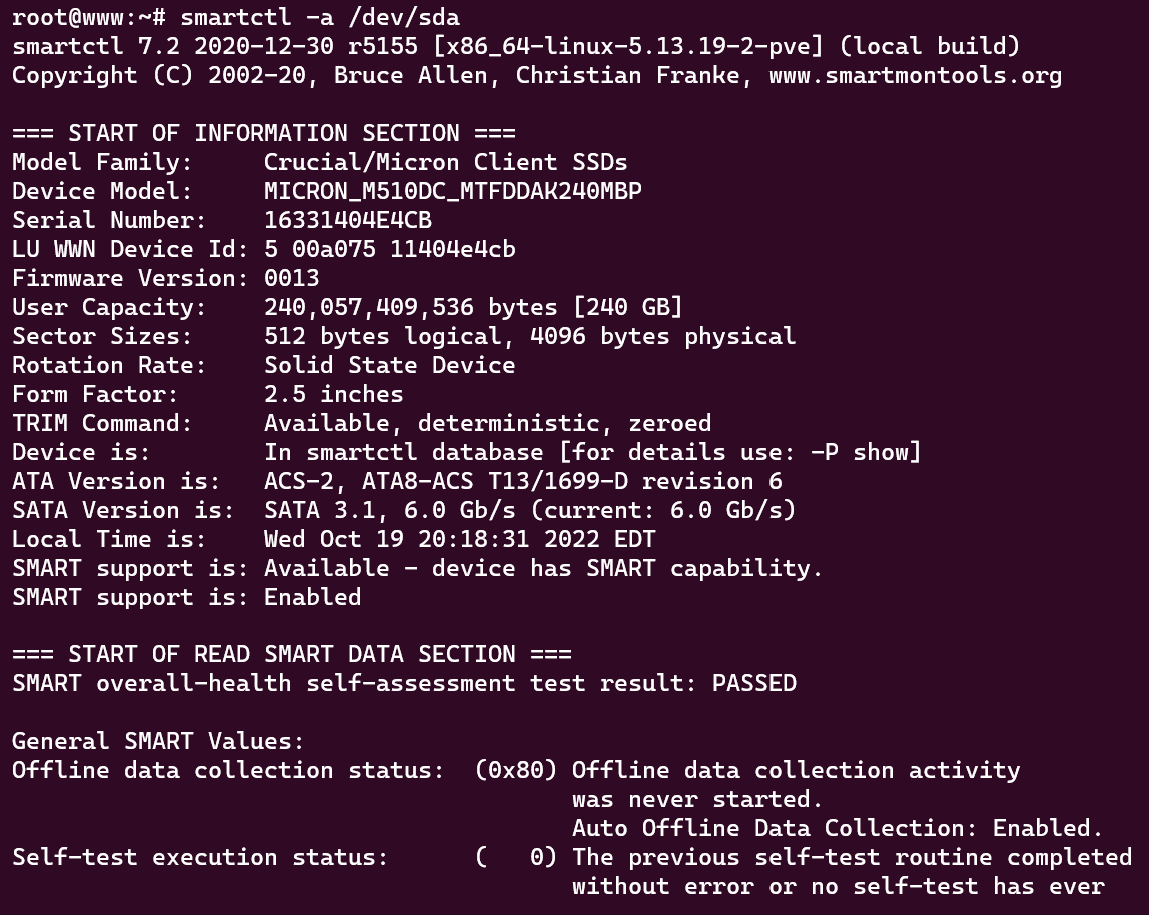
Evaluating NVMe Solid-State Drives (M.2 SSD)
This section includes instructions for generating reports for NVMe drives, which require a different package to retrieve their health information. In this particular case, we’ll be using the nvme-cli package.
- First, check that the nvme-cli package is available on your system already. If not, install it with your package manager using the command:
yum install nvme-cli
- Next, use the following command to retrieve a list of your available NVMe devices:
nvme list
- To retrieve the health results of a specific drive you’d like to evaluate, use the command listed below. In this particular example, the drive we’re checking is /dev/nvme6n1.
nvme smart-log /dev/nvme0n1
- Lastly, use following command to retrieve the error logs of the drive in question.
nvme error-log /dev/nvme0n1
Performing Drive Tests on SATA Hard-Disk Drives and SSDs
The smartmontools package smartctl tool allows users to perform four tests that evaluate the input/output [IO] capabilities of their storage device. The four tests are listed below and can be performed to evaluate drive health and performance.
*Note: please be advised that if the disk is not in good condition and has a FAILED SMART status, then these tests will only put further stress on the device and are therefore not recommended. If you have any concerns regarding this, please reach out to our Technical Support for further assistance.
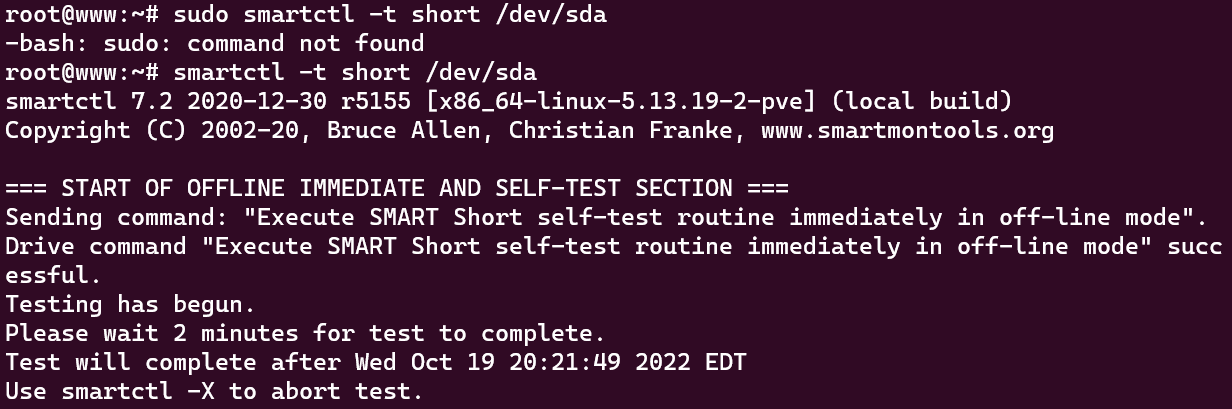
- The first test is a short test which performs a short write test on the drive to evaluate for errors. In this particular example the drive we’re checking is /dev/sda.
sudo smartctl -t short /dev/sda
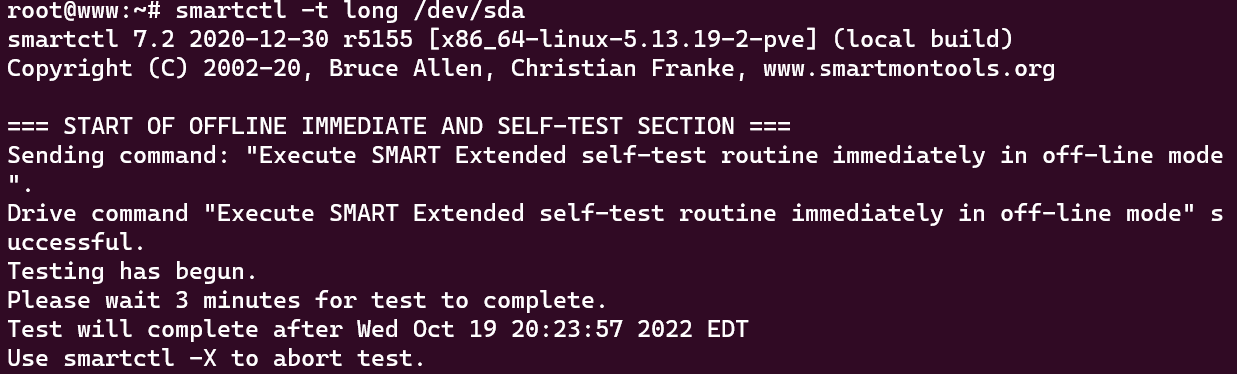
- The second test is a long test which performs a longer write test on the drive to evaluate for errors. Once again, the drive we’re checking in this example is /dev/sda.
sudo smartctl -t long /dev/sda
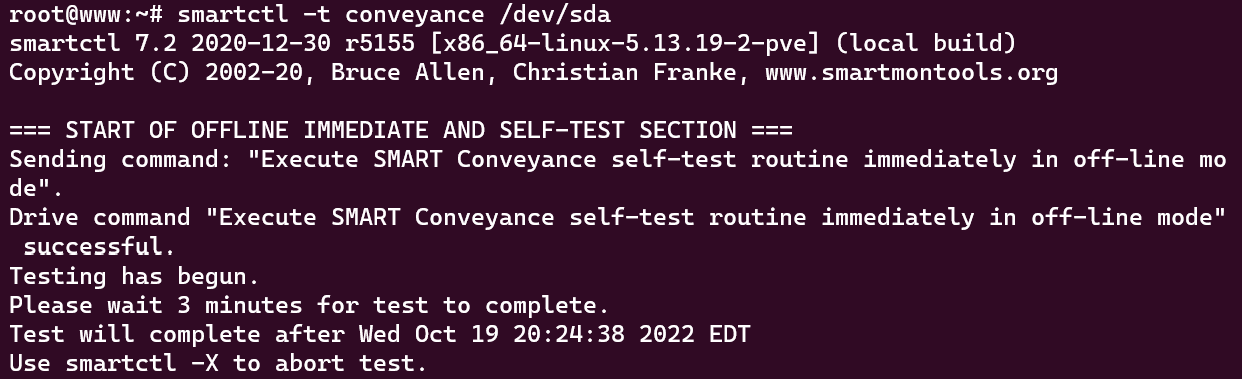
- The third test is a conveyance test (normally used for PATA Drives) which performs a test to check for possible damages that can occur during device transport.
sudo smartctl -t conveyance /dev/sda
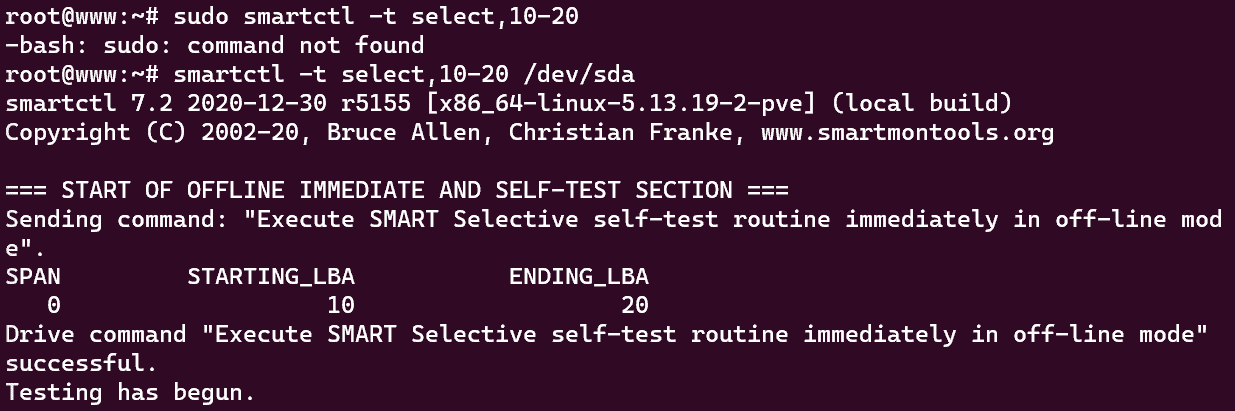
- The fourth test is a Select test (normally used for PATA drives) which is meant to check only a specified range of logical block addresses (LBAs).
sudo smartctl -t select,10-20 /dev/sda
Once these tests have been completed, results for each test can be found by running the following command (the results are located at the bottom of the report):
sudo smartctl -a /dev/sda
*Note: to abort any test after it has begun running, use the following command:
smartctl -X /dev/sda
Evaluating the S.M.A.R.T DATA Report
The reports given by the smartmontools package smartctl tool can be intimidating at first. In the following section we’ve provided information which should help you make sense of these reports and take action when necessary.
First and foremost, don’t panic. The attributes and values you see in the report might make you think your drive is in trouble, but it’s important to understand that all drives will eventually have some less-than-ideal values showing for certain attributes. This alone does not necessarily mean that your drive is in trouble.
Two important notes:
- Some of the items listed below might not exist in your report as some of these are brand-dependent.
- The items listed below are not a complete list of all attributes which may be shown. These are however the attributes that require the most attention when reading the report.
Important S.M.A.R.T. Report Attributes and What They Mean
- Read Error Rate – (the lower this value the better) – this shows the rate of read errors occurring when a disk is being read.
- Throughput Performance – (the higher this value the better) – this shows the overall performance of the hard disk drive which ideally should not be a lower value than what is normally seen.
- Spin-Up Time – (the lower this value the better) -This shows the average time it takes for the drive to become fully operational.
- Reallocated Sectors Count – (the lower this value the better) – This shows the count of bad sectors that have been found and remapped. *Note: A high value of reallocated sectors with a large amount observed when looking at daily trends can indicate a possible drive failure.
- Current Pending Sector Count – (the lower this value the better) – This shows the count of sectors waiting to be remapped because of unrecoverable read errors.
- Seek Error Rate – (the lower this value the better) – This shows the rate of seek errors found on the magnetic heads within the drive. *Note: high values in this attribute indicate potential failure with the mechanical positioning system.
- Seek Time Performance – (the higher this value the better) – This shows the performance of the drive’s seek operations.
- Power-on Hours – This shows the count of hours that the drive has on record for the power-on state. *Note: the recommended value for life expectancy of a drive depends on the drive brand and model.
- Spin Retry Count – (the lower this value the better) – This shows the count of spin start retries as the drive attempts to reach full operational speed.
- Reported Uncorrectable Errors – (the lower this value the better) – This shows the count of errors that could not be recovered using the hardware’s error correcting code.
- Command Timeout – (the lower this value the better) – This shows the count of aborted operations to hard-disk drive timeout.
- Reallocation Event Count – (the lower this value the better) – This shows the total count of attempts to transfer data from reallocated sectors to spare areas.
- Soft Read Error Rate or TA Counter Detected – (the lower these values the better) – These indicate the number of uncorrectable read errors.
-written by Pascal Suissa
